
Nutanix Xi Epoch
Observability and Monitoring
Overview:
With cloud applications increasingly central to the business, organizations need a means of monitoring and assessing the health and performance of cloud apps, as well as troubleshooting outages. Epoch is the answer.
Run all your enterprise apps, on any infrastructure, worry-free
Visualize the interactions of your apps, and pinpoint performance issues before they impact your end users.
- Real-time Visibility
- Smart KPIs
- Rapid Response
Map interactions and performance changes among all your apps, infrastructure, and clouds.
Automatically aggregate key performance indicators to uncover actionable insights.
Leverage deep analytics to speed outage investigations and improve mean time to resolution (MTTR).
Confirm Your Application Health
- Instantly Visualize Interactions
- Measure What Really Matters
- Accelerate Your Outage Response
Quickly and easily ensure the reliability and availability of any application in any environment using Epoch's live application maps. Without additional code instrumentation or development resources, Epoch visualizes the interactions between components, providing operators instant access to deep analytics and enabling them to quickly pinpoint bottlenecks.
Monitor your service level objectives holistically, and set alerts for aggregated KPIs, rather than tracking thousands of low-level notifications. Epoch delivers out-of-the-box alerting for "golden signals"-such as latency, error rates, and throughput-that provide operations teams powerful insights into events and trends that can impact end-user experience and application uptime, while eliminating alert fatigue.
Epoch empowers operators with a robust analytics engine that renders millions of data points in real-time to accelerate outage investigations. Thanks to subsecond response times, teams can quickly test failure hypotheses and drill-down into applications and infrastructure, leading to dramatically lower mean-time-to-resolution (MTTR) and increased application uptime.
Vendor Agnostic Full-stack Monitoring
With no reliance on infrastructure and 250+ integrations, Epoch enables you to instantly monitor every application regardless of where it runs.
- Auto-discover Application Maps
- Focus on Key Alerts
- Leverage Powerful Analytics
Create and share maps that reveal services and dependencies. Monitor real-time traffic flow between all internal and external services.
Cut through the noise from the infrastructure stack with holistic metrics monitoring based on specific tags and attributes.
Accelerate troubleshooting with a query-centric interface, deep drill-down data, and numerous out-of-the-box dashboards.
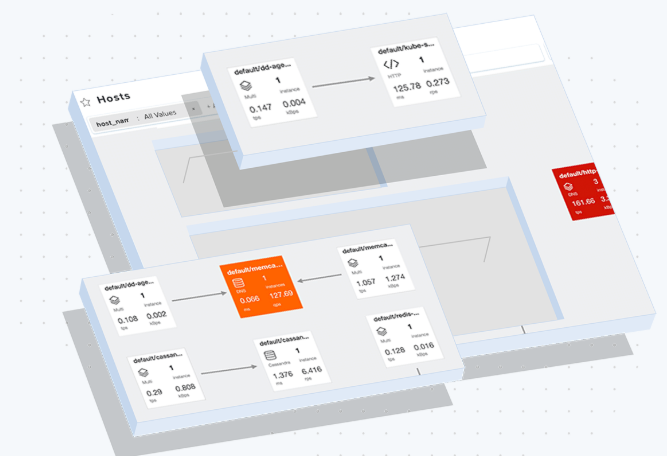
See Everything with Auto-discovered Application Maps
Think "Google Maps" for your cloud applications
- Create and share maps by filtering and grouping hosts & containers by tags and traffic attributes
- Search and Discover services and their dependencies
- Monitor real-time traffic flow between all internal and external services
- Time Travel to compare past behavior, for example, before and after deployments
- Out of the box maps for popular platforms such as Kubernetes (pods & namespaces) etc.
Stay One Step Ahead of Performance & Reliability Problems
Maps help eliminate hotspots by pinpointing issues across services and infrastructure
- Key Performance Indicators such as latency, throughput are available on the services and their links for API calls, DB queries, DNS queries, etc.
- One-click Drill-down into the complete health metrics for services and infrastructure
- Table View to sort and identify slow queries, high demand API calls, etc.
Monitor Every Component with Metrics from the Entire Stack
Comprehensive collection that gives you fastest time-to-value
- Packet Capture and Analysis to monitor performance of service interactions
- Leverage SSLSplit for observing encrypted traffic
- 70+ Application Integrations with JMX, NGINX, MySQL and many more, for metrics such as heap size, thread counts, connections, etc.
- Custom Metrics, using statsd, for code-level insights
- External Service interactions performance analysis such as latency of AWS RDS, DynamoDB queries or DNS errors in Route53 lookups
Alert On Metrics That Impact End Users
Keep a close tab on key metrics and get notified before critical issues occur
- Latency, Error and Throughput alerts before end users experience slowness or errors
- Alert Templates to define the rules once and reuse across multiple similar services
- Scope Alerts on user defined groups, on tags and attributes, or globally
- Pagerduty, email or webhooksintegrations for alert notifications
Accelerate Troubleshooting with Powerful Analytics
A powerful query-centric interface and a low-latency query engine to get to answers quickly
- Analytics Sandbox to explore and visualize metrics and save results as alerts or dashboards
- Extensive Filters and Group-By options to analyze data from multiple dimensions such as pod names, host names, or protocol attributes such HTTP URI, MySQL Query Types, etc.
- Out-of-the-box Dashboards for all popular systems such as HTTP, MySQL, DNS and also for frameworks such as Kubernetes
- Dynamic Drill-in from the charts to segment and analyze data from multiple dimensions
Self-host Epoch's Application Operations Center
- Secure Monitoring Your network, your rules.
- Easy Installation on AWS, Azure, GCE, Kubernetes, Docker and more
- Self-hosted or SaaS cloud deployment options
- Zero-Ops with containerized deployment, built-in self-healing and one-click upgrades
- Multi-tenant and RBAC for granular access controls to data
- Single sign-on for integration with your identity management solution